
Build a self-updating Looker Studio/Sheets pipeline from GSC + GA4 using scheduled jobs, ETL pipelines, and alerts for faster SEO decisions.
 by Rizwan
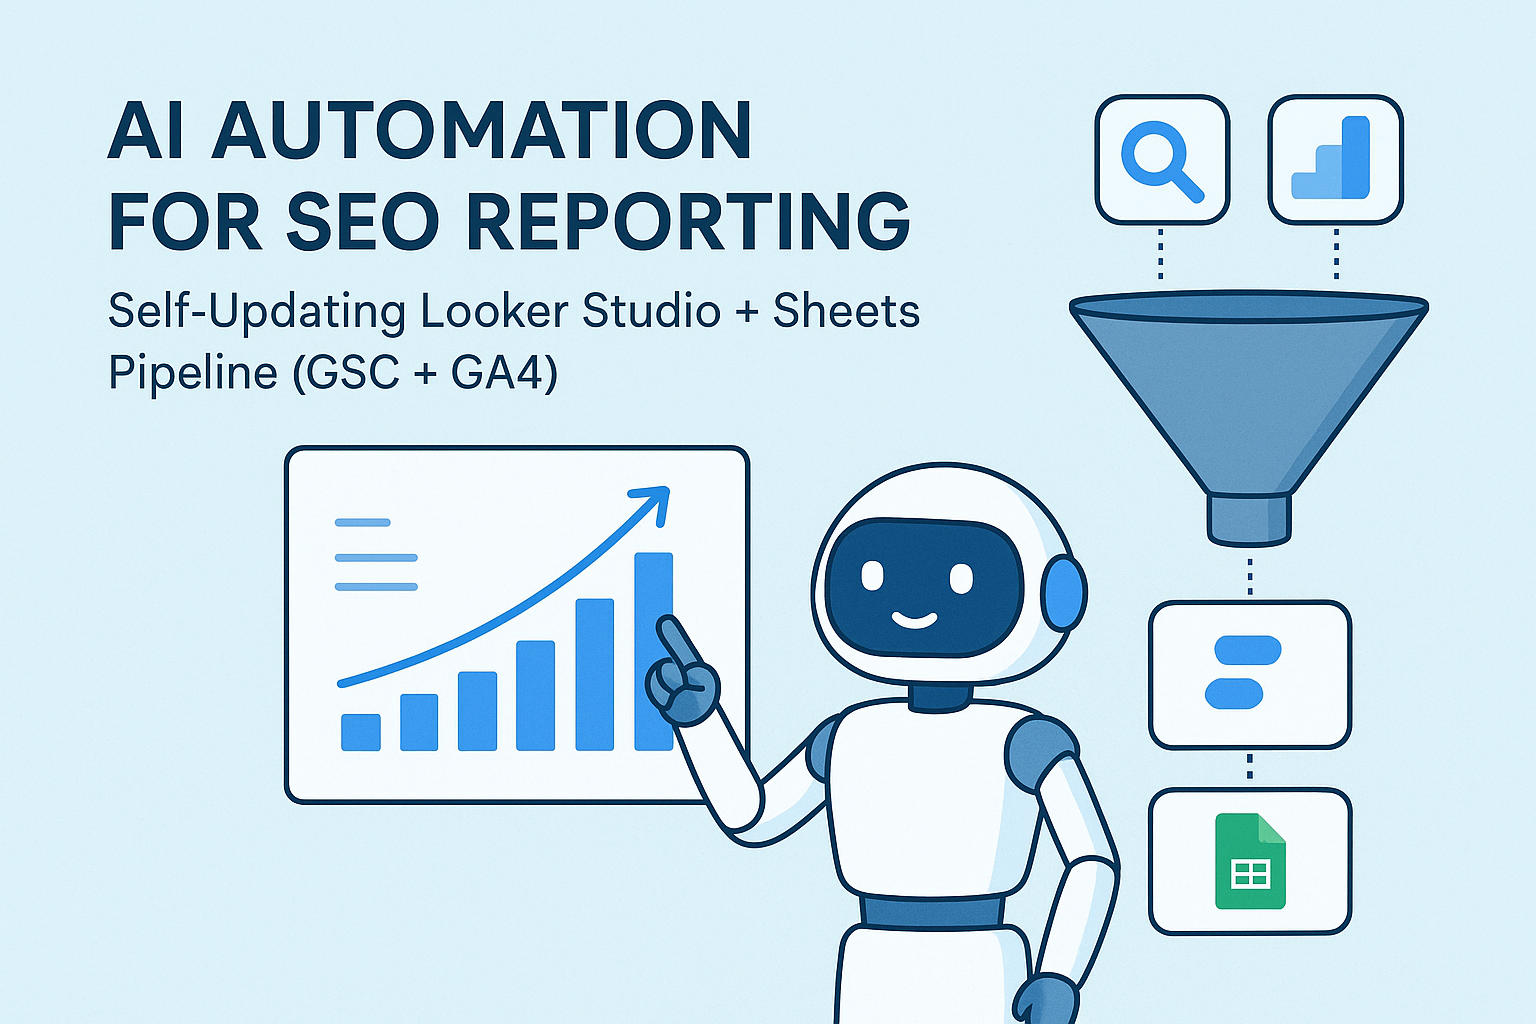
Most SEO reporting breaks for one reason: the data stops being trustworthy before the next meeting. When your pipeline relies on manual exports from the Google Search Console API and the GA4 Data API, you inevitably miss edge cases, run into API quotas, or ship dashboards with stale numbers.
A self-updating pipeline fixes this by treating reporting like production software: repeatable ETL pipelines, clear KPI definition, and data freshness SLAs. Once the data lands in a stable model (often BigQuery), Looker Studio becomes a read-only layer that updates automatically.
Here’s a production-grade blueprint that works for startups, SaaS teams, and agencies. It’s designed to minimize manual work while keeping enough control for technical SEO and analytics teams.
In most implementations, you’ll use Python scripts for ingestion and transformation, then orchestrate with a scheduler (Cloud Scheduler, cron, or an orchestrator like Airflow). The key is to separate raw ingestion from reporting logic.
Even if you use Looker Studio as the main dashboard, Google Sheets automation is useful for lightweight operational workflows: stakeholder summaries, manual QA notes, and quick exports for client decks. Keep Sheets as a consumer of curated data, not as the system of record.
Self-updating pipelines fail when KPI definition is ambiguous. “Organic traffic” can mean sessions, users, or landing page clicks depending on the team. Lock the definitions early, then enforce them in the transformation layer.
Then define a data contract: required fields, allowed nulls, and expected ranges. This contract becomes your validation checklist and your basis for anomaly detection.
For GSC, you typically pull performance data by date range, then aggregate by landing page and query. The Google Search Console API supports query and page-level metrics, but you must plan around API quotas and rate limits.
A common mistake is building transformations directly on top of “latest pull” tables. If a pull fails mid-run, your dashboards can silently show partial data. Always write to a staging table first, then promote only after validation passes.
For GA4, you’ll pull metrics like sessions, users, engagement rate, and conversions. The GA4 Data API is flexible, but you need to be disciplined about dimensions and filters so that your reporting aligns with GSC.
To connect GSC and GA4, you need a consistent landing page key. Use a canonicalization step (strip fragments, normalize trailing slashes, and decide how to treat query strings). This is where you prevent mismatched rows and “why don’t these numbers add up?” meetings.
Also enforce UTM hygiene rules. If your paid campaigns contaminate organic segments, your “SEO trend” charts become unreliable. Treat UTM normalization as a transformation responsibility, not a dashboard tweak.
Once raw data is stored, transform it into curated tables that match your dashboard needs. This is where you implement KPI definition logic, URL normalization, and segmentation rules.
If you’re using BigQuery, views and materialized tables can help. If you’re using Sheets as a target, you still want a curated layer first-otherwise you’ll end up with brittle formulas and slow refreshes.
Self-updating pipelines require operational guarantees. Define data freshness SLAs like “GSC data must be updated within 6 hours of the end of day” and “GA4 data must be updated within 12 hours.” Then enforce them automatically.
For orchestration, you can use Cloud Scheduler + a serverless function, cron + a container, or an orchestrator. The important part is that the pipeline is observable and repeatable.
After you have stable curated tables, add machine learning anomaly detection to catch meaningful changes. The goal is not to alert on every fluctuation; it’s to catch issues that require action.
Use a baseline window (e.g., last 28-56 days) and alert only when anomalies exceed thresholds. Store anomaly results with context (metric, date range, affected pages/queries) so your team can investigate quickly.
Alerts should be actionable. A good alert includes what changed, where it changed, and what to check next. Use email/Slack alerts for different severity levels.
A common mistake is sending raw logs to Slack. Instead, send a short summary plus a link to the relevant Looker Studio dashboard section.
Now that your curated layer is stable, Looker Studio becomes straightforward. You connect to curated tables (or views) and build charts that match your KPI definitions.
For SaaS teams, app pages often have unique indexing behavior. If you’re also working on crawl and indexing mechanics, pair this reporting pipeline with the technical SEO playbook for SaaS dashboards so your metrics map to the underlying indexing strategy.
Once dashboards are stable, Google Sheets automation can generate stakeholder summaries without manual exports. Typical uses include weekly “top movers” tables and client-ready change logs.
Keep Sheets formulas minimal. If logic grows, move it back into ETL pipelines so you preserve data consistency.
Automation tools can accelerate early prototypes, but reporting pipelines need reliability. The trade-off is speed versus control, especially around API quotas, retries, and data contracts.
| Approach | Best for | Risks |
|---|---|---|
| Zapier-style automation | Small teams, low volume, quick experiments | Harder to enforce data freshness SLAs and complex transformations |
| Custom code + scheduler | Production reporting, multiple sources, strict KPI definitions | Requires engineering time and operational ownership |
| Hybrid (Sheets automation + curated ETL) | Dashboards in Looker Studio with Sheets for summaries | Must avoid duplicating transformation logic in Sheets |
If you need consistent daily reporting, anomaly detection, and SLA enforcement, custom code with Python scripts and a curated data layer is the reliable path.
If a job fails after writing some rows, dashboards can show incomplete data without obvious errors. Fix it by promoting staging to curated only after validation passes.
Trailing slashes, query strings, and redirects can break joins. Fix it by centralizing URL normalization and applying it to both sources.
If you compute KPIs in both ETL and Looker Studio, you’ll get inconsistent results. Fix it by pushing KPI logic into the curated layer and keeping dashboards as visualization only.
Too many alerts makes the system useless. Fix it by using thresholds, baselines, and severity levels tied to business impact.
Once your GSC + GA4 reporting is reliable, you can extend the same pipeline pattern to technical SEO inputs: crawl logs, index coverage exports, and structured data validation results. If you’re also improving structured data quality, align reporting with schema changes using schema engineering for SaaS so you can correlate rich result eligibility with performance trends.
For debugging crawl waste and indexing issues with real data, connect your reporting cadence to operational signals from your infrastructure using technical SEO debugging with server logs.
Ready to start your project? Let's work together to make it happen! Get in touch with us today and let's bring your ideas to life.
Get In Touch